How to install and use the Query Monitor plugin
This article describes how to install and use the Query Monitor plugin, a debugging tool that helps you monitor WordPress performance. With Query Monitor, you can track many things, including:
- Database queries.
- HTTP request and response headers.
- Scripts, including hooks and actions.
- Site environment information, including the server, PHP, MySQL, and WordPress.
Table of Contents
Installing the plugin
To install Query Monitor on your WordPress site, follow these steps:
- Log in to your WordPress site as the administrator.
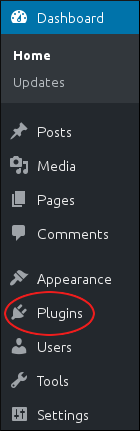
- In the left sidebar, click Plugins:
- Click .
In the Search plugins text box, type query monitor, and then press Enter:

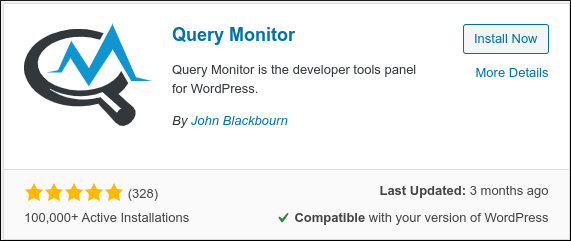
Locate Query Monitor, and then click Install Now:
After WordPress finishes installing the plugin, click Activate. The Query Monitor appears in the toolbar:

Using the plugin
After you install the Query Monitor plugin, you are ready to monitor your site. To do this, follow these steps:
- Log in to your WordPress site as the administrator.
- On the toolbar, select an option from the Query Monitor menu:
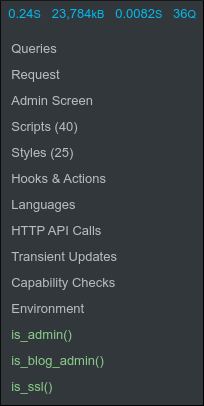
For complete information about all of these options, please see the Query Monitor documentation at https://github.com/johnbillion/query-monitor. Some of the most useful options are:
- Queries: This option shows the raw database queries that were used to help generate the current page, as well as the functions that ran the queries.
- Request: This option shows the HTTP request for the current page.
- Scripts: This option shows all of the script files loaded for the current page.
- Styles: This option shows all of the style (CSS) files loaded for the current page.
- Hooks & Actions: This option shows all of the hooks and their associated actions for the current page.
- Environment: This option shows environment settings for the site, including PHP, MySQL, WordPress, and the web server.
More Information
For more information about the Query Monitor plugin, please visit https://wordpress.org/plugins/query-monitor.
Article Details
- Product: All accounts
- Level: Intermediate
Grow Your Web Business
Subscribe to receive weekly cutting edge tips, strategies, and news you need to grow your web business.
No charge. Unsubscribe anytime.
Did you find this article helpful? Then you'll love our support. Experience the A2 Hosting difference today and get a pre-secured, pre-optimized website. Check out our web hosting plans today.