How to Use Chrome DevTools to Test Your Website

These days, there are a lot of platforms that enable you to create a website without any technical experience. Even if you’re not a web developer, you can put together an attractive and functional site quickly. However, at some point you may want to expand your skill set and learn how to interact with the code behind your site.
Fortunately, there are ways to do this that don’t require you to learn everything from scratch. For instance, most modern browsers include built-in tools that let you see your site’s code and test its functionality easily. Chrome’s DevTools is the perfect example of this kind of solution.
In this guide, we’ll introduce Chrome DevTools and explain how to start using it. Let’s begin!
An Introduction to Chrome DevTools
As you spend more time working on your website, you’ll find there are some things that are difficult to do through a site builder’s interface. At the same time, you may not have the technical experience (or time) to build a site entirely from scratch.
Browser-based developer tools enable you to see and interact with your site’s code, no matter how it was built or what platform it’s running on. This helps you learn about how your site works, as well as more easily test changes and troubleshoot errors. Once you become adept with these tools, they can even be a faster way of performing tasks you might usually handle from your site’s dashboard.
Nearly all popular browsers offer this type of feature. However, we’ll focus on the most commonly-used browser: Chrome. Using this browser, you have the option to access the Chrome DevTools:
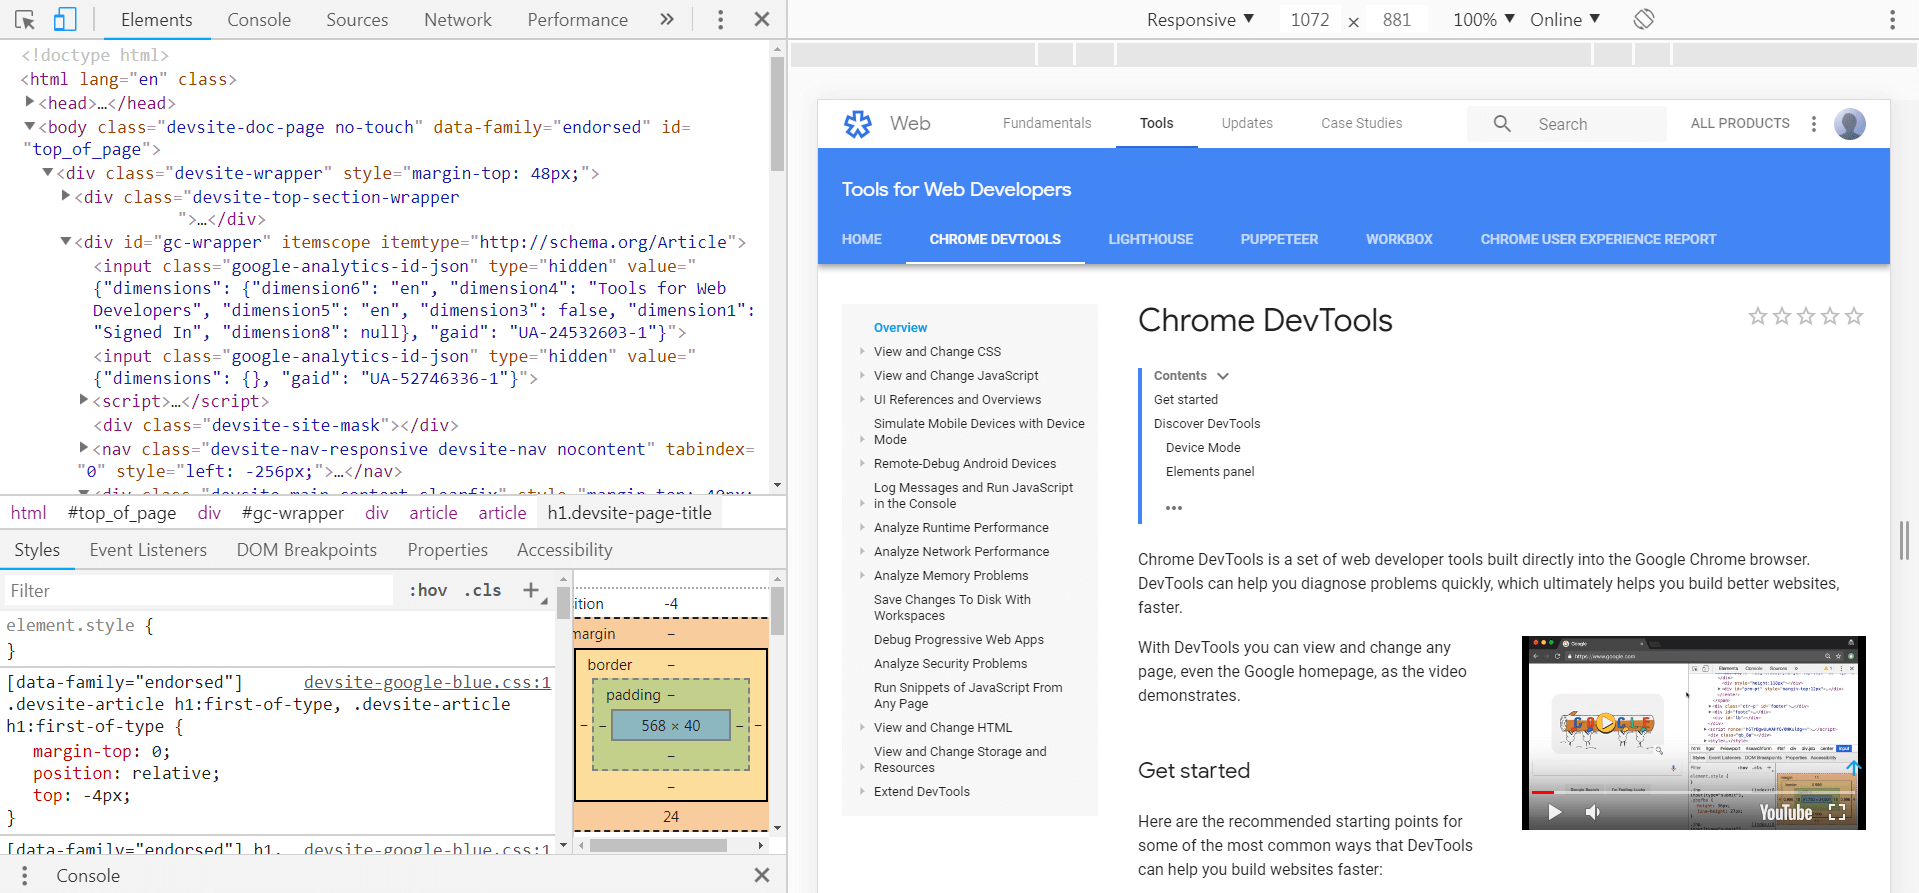
This enables you to view the code behind any page on the web – whether or not it’s your own site. DevTools also lets you test changes to a page, analyze performance, view error messages, and perform troubleshooting.
How to Access Chrome DevTools in Your Browser
For the reasons stated above and more, Chrome DevTools can be incredibly useful. What’s more, it’s free to use and can be accessed without installing any additional software or extensions.
In fact, all you need to do in order to use Chrome DevTools is open any web page using Chrome. For the best results you’ll want to have the latest version of the browser installed.
Then, right-click on the web page you want to examine. Select Inspect from the menu that appears:

This will open up the Chrome DevTools panel:
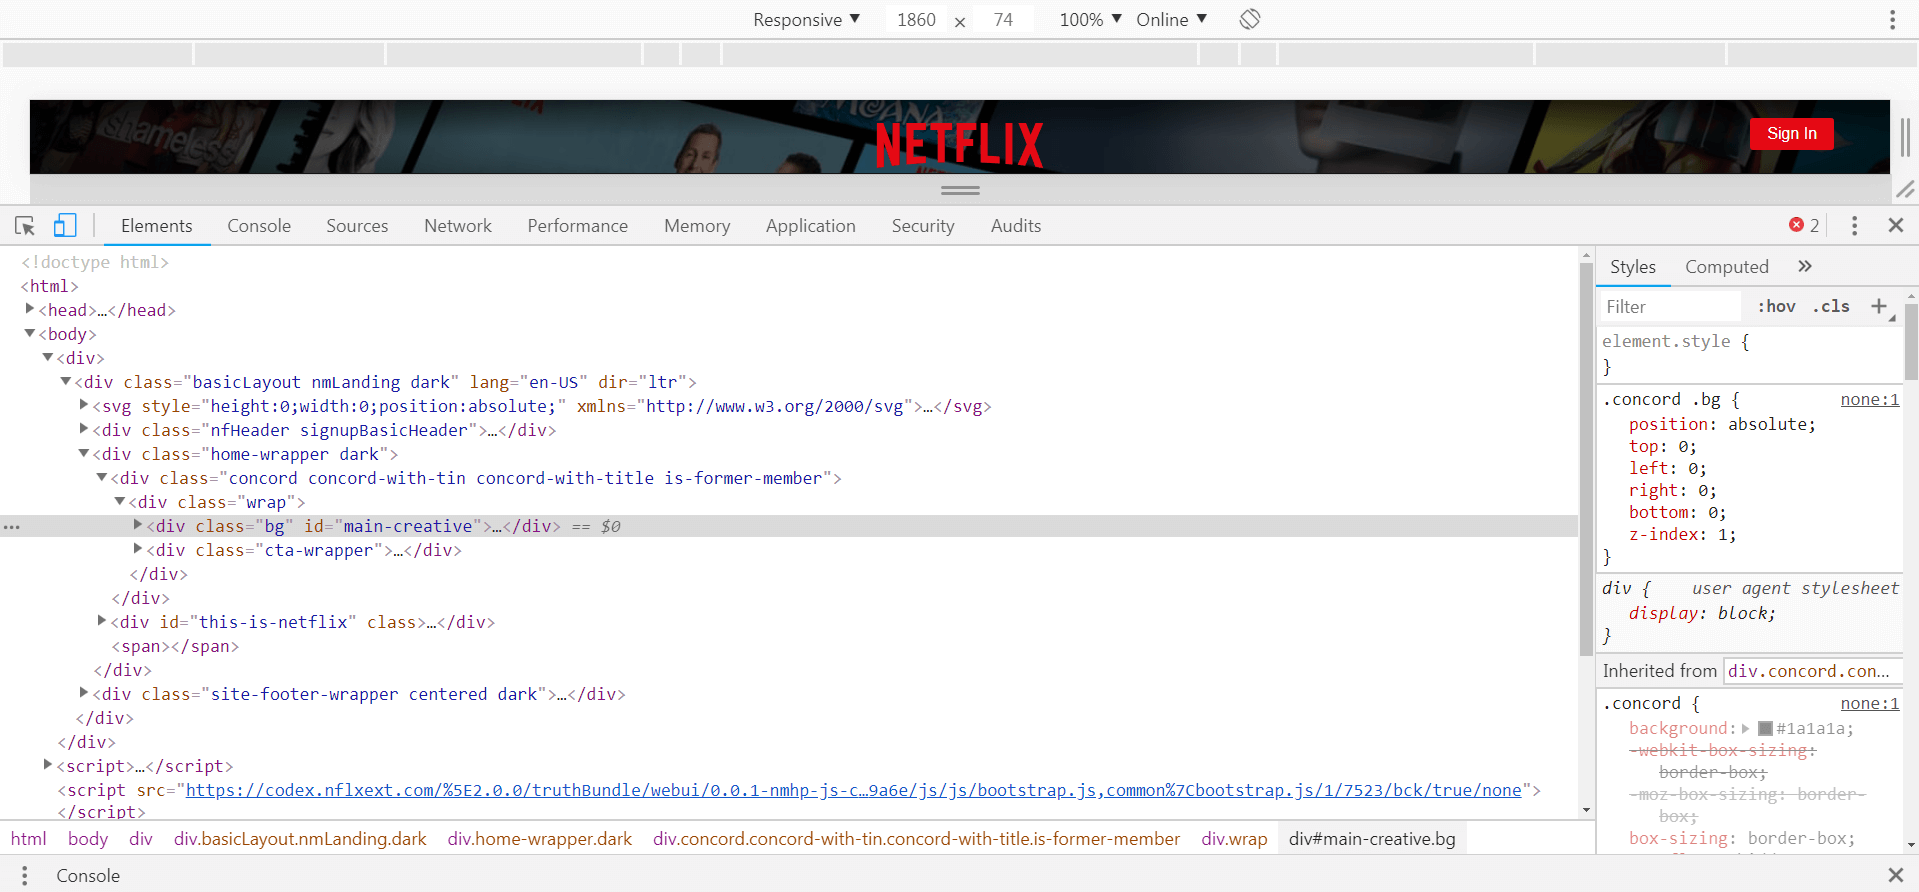
It may look a little intimidating at first. However, with some time and experience, you’ll become familiar with most of these options. It’s also worth noting that you can rearrange the sections in order to make working with the DevTools easier.
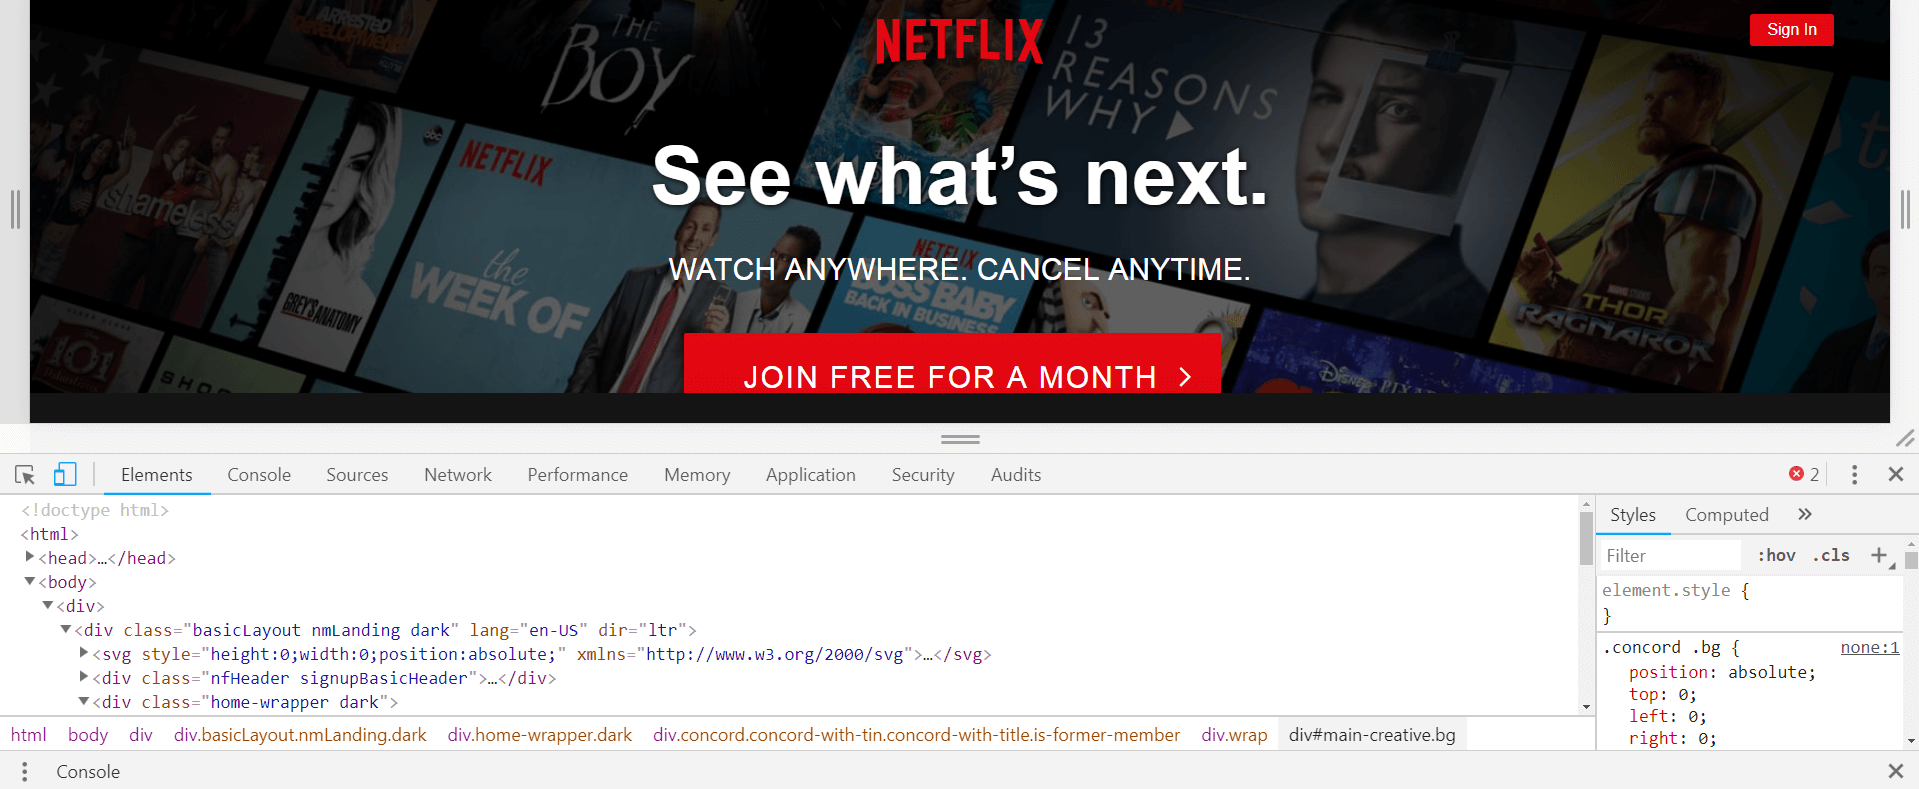
For example, if the code window is taking up most of your screen, you can click on the parallel lines at the top of the section and drag them down. This will let you see both the code and the web page itself simultaneously:
Plus, by selecting the three dots on the right side of the screen, you can choose from several additional display options:
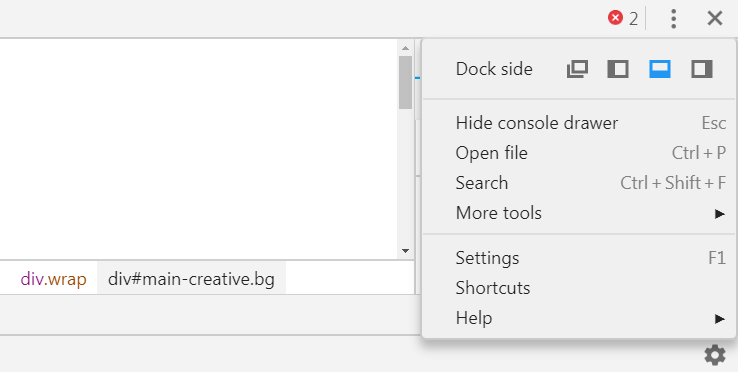
For example, one of these options lets you display the code and page side-by-side. For most people, this is an optimal configuration:
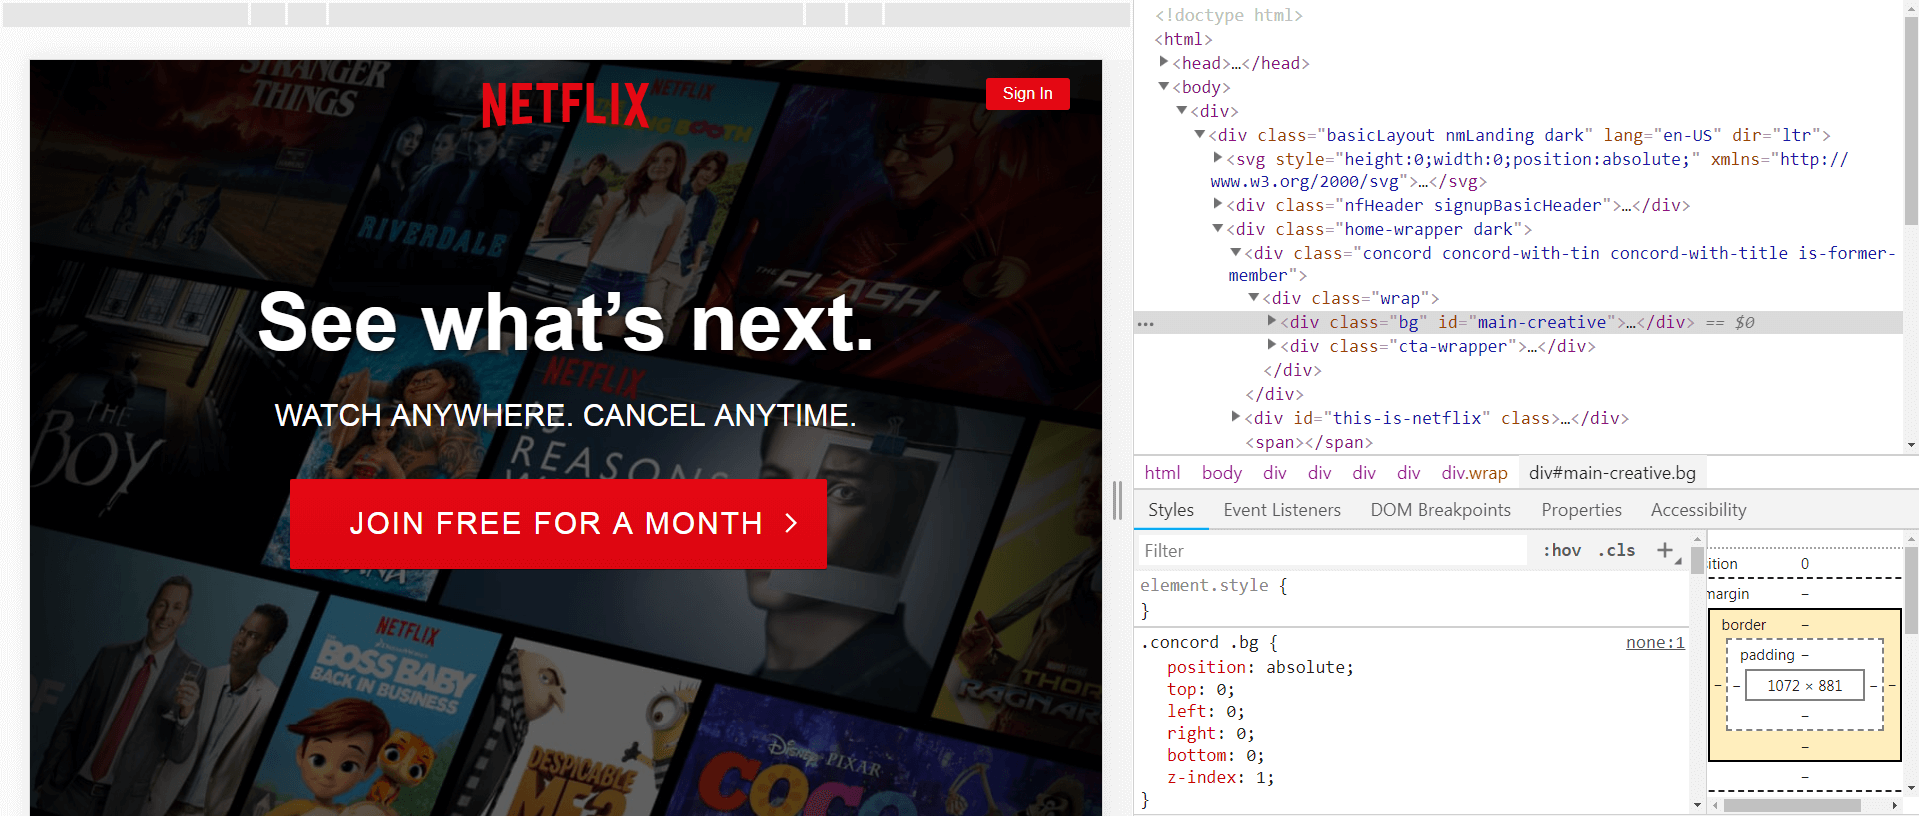
Once you have the window set up the way you like, you can start using it to perform your testing and troubleshooting.
How to Get Started With Chrome DevTools
We should make it clear that DevTools is a complex feature with a lot of options. You can accomplish many tasks by using it – from basic website tweaks to in-depth coding work.
As such, we aren’t going to try and cover everything DevTools can do in this guide. Instead, we’ll wrap up by introducing you to a couple of its most basic features. This will give you a chance to get your feet wet and familiarize yourself with this toolbox.
First, you may have noticed that there’s a lot of code making up even the simplest web page. If you want to work with a specific section of a page, it can be hard to find the corresponding code by simply browsing through the DevTools window.
Instead, you can go straight to any element you want by highlighting it on the web page. For example, here we’ve highlighted the page’s title:

Then, right click on that area and select Inspect. Chrome DevTools will open, but this time it will automatically take you to the section in question. It will be highlighted within the page’s code:
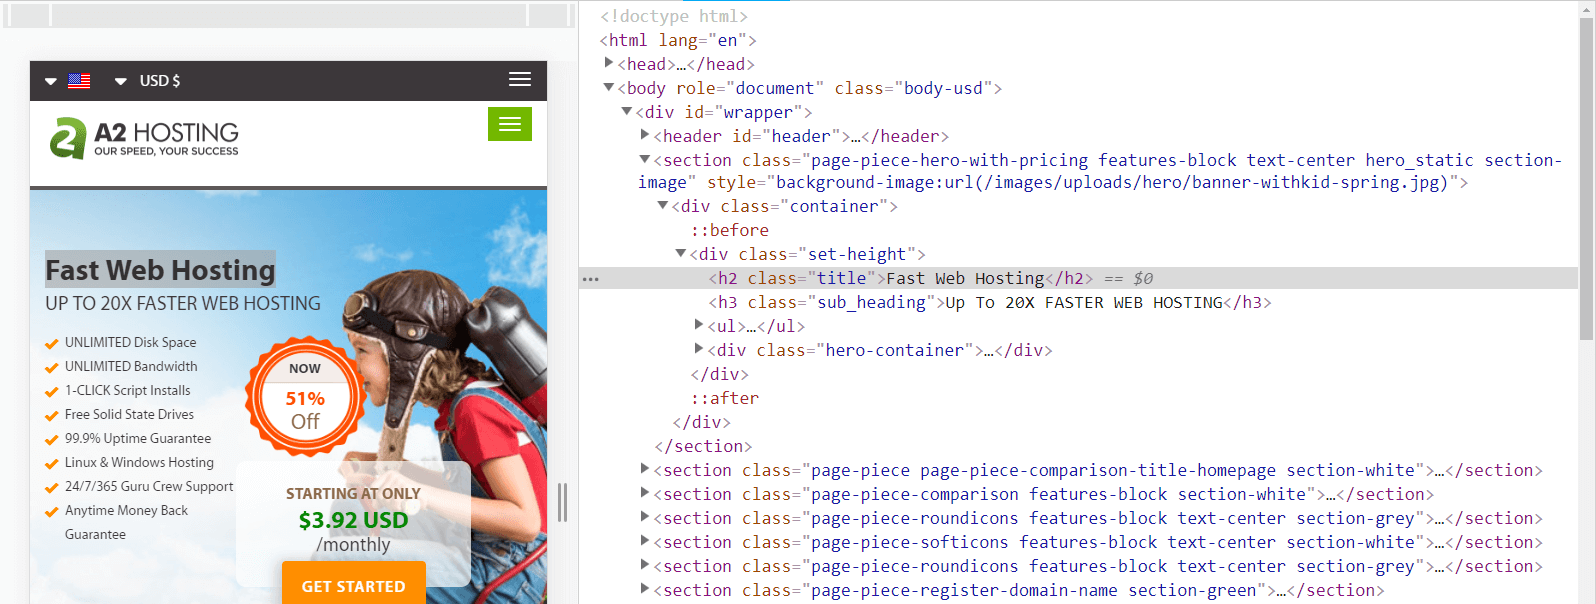
At this point, you can go ahead and make changes to the element if you want. For example, we can simply enter a new page title in place of the old one:
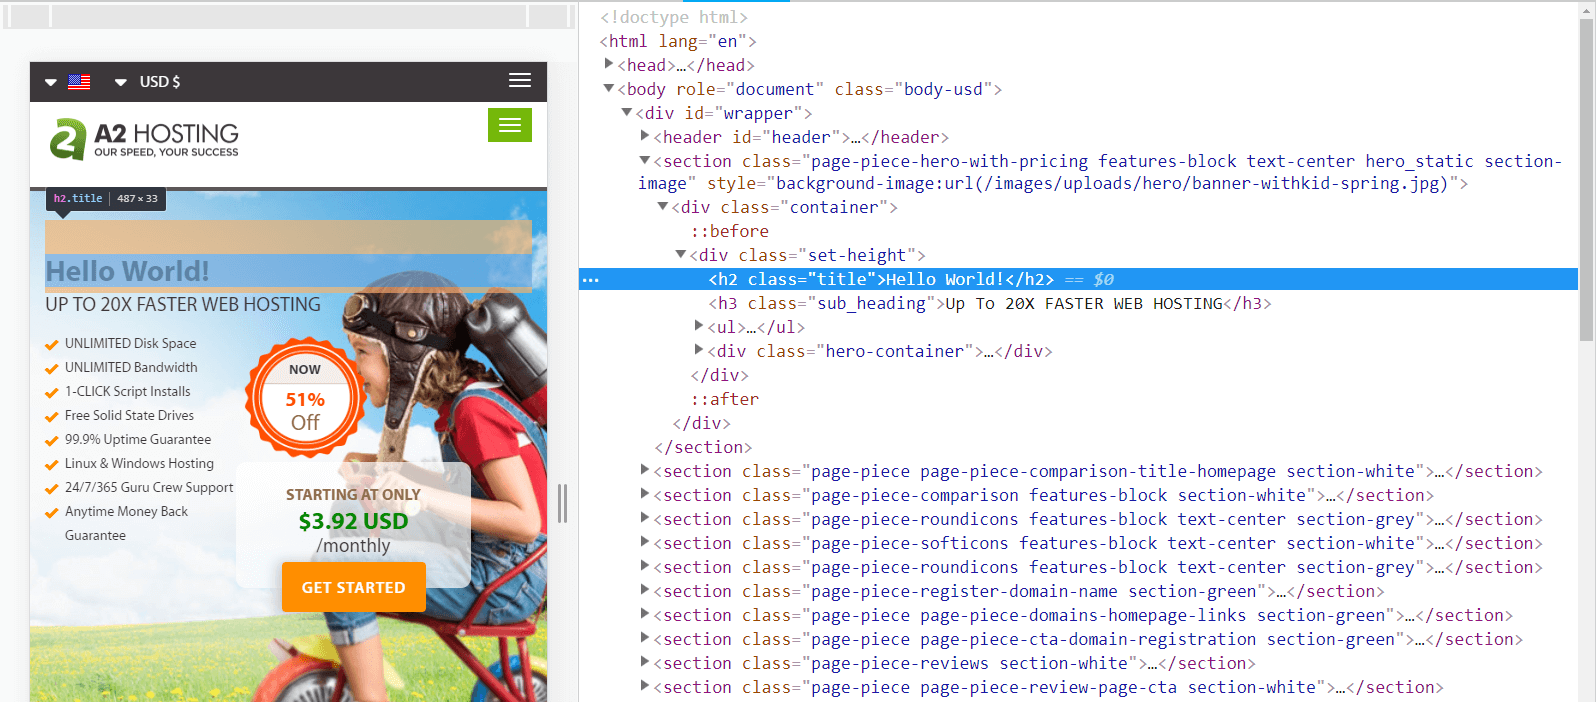
You’ll see your changes take effect immediately. Even if you close the DevTools window, they’ll remain on the page:

You’re not making permanent changes here, of course. Otherwise, you could edit anyone’s website without their permission. The alterations will disappear if you reload the page. However, this technique lets you see what your changes will look like. You can even take screenshots to share with other people.
Finally, you can also use these same tools to perform some basic troubleshooting. Let’s say that a feature on your site isn’t displaying properly. In this example, our search form isn’t appearing in the sidebar with the rest of our widgets, but off in a corner:

As before, you can highlight the problem element and inspect it to see its associated code:
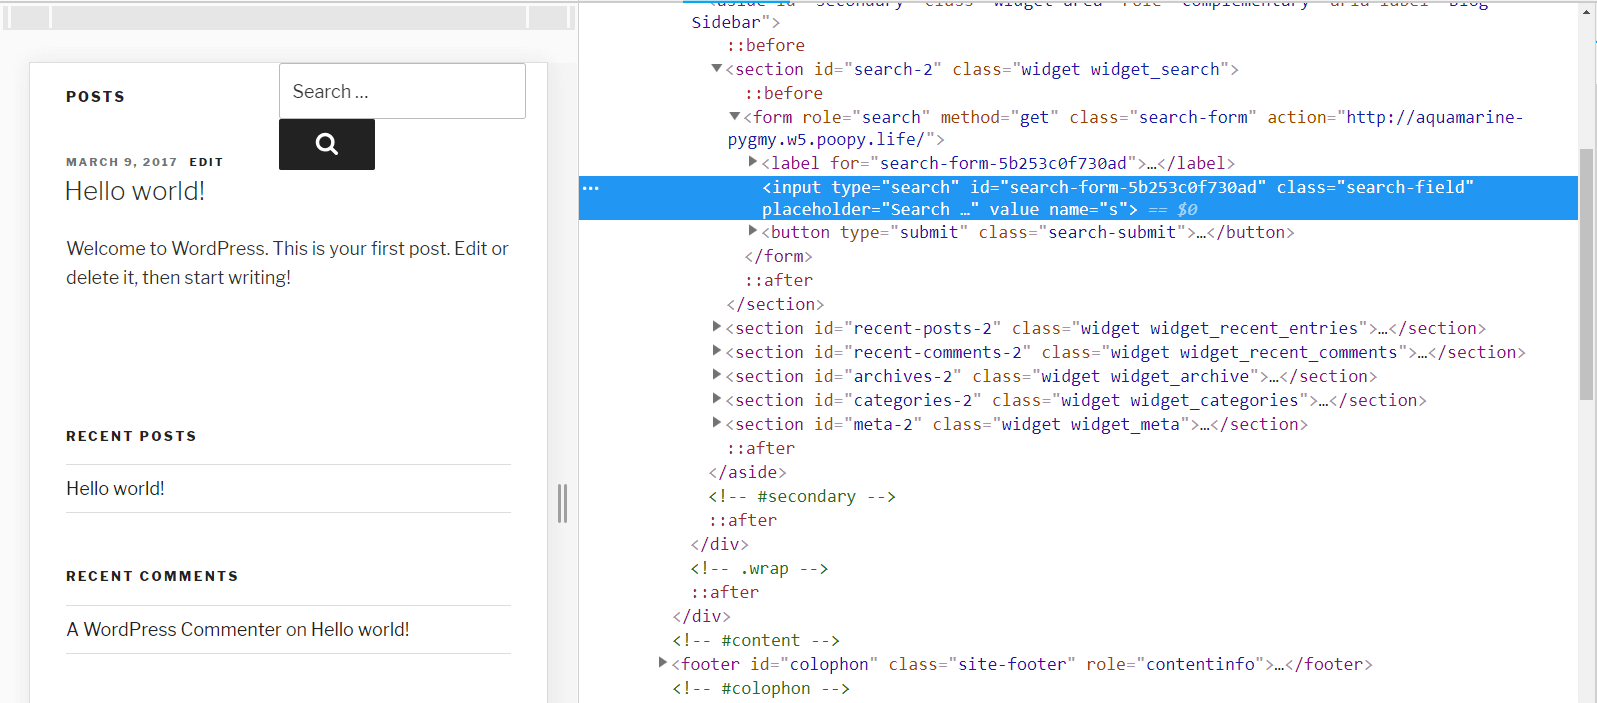
If you do have some knowledge of HTML and other key languages, you may be able to fix the issue on your own at this point. If not, you at least know where the problem is. You can take this code snippet and start searching for a solution, or share it with someone who has the know-how to pinpoint a fix.
Like we mentioned, this is just a small sample of what you can accomplish using Chrome DevTools. We encourage you to play around with the tools on your own, and to check out Google’s own comprehensive documentation on the subject.
Conclusion
It’s often much easier to work on your site and troubleshoot errors if you can see the code behind-the-scenes. Chrome DevTools makes this possible for anyone, without requiring any special software. Experimenting with DevTools is also an excellent way to start learning more about how web pages are put together – whether they’re yours or someone else’s.
To use DevTools, all you have to do is select Inspect on any page on the internet. You’ll then be able to see all of its source code. From that point you can test out various changes, look for the source of problems, and more. In time, this can become a faster and more effective way of performing certain tasks on your site than working through your dashboard.
Image credit: Wikimedia Commons.