- Nov 04, 2016
 0
0- by A2 Marketing Team
It can be said that a successful website is built in equal parts great content and a solid understanding of your audience. While your content may be first-class, if you don’t know where your traffic is coming from (and the topics your audience is interested in), you’re missing half of the formula.
Google Analytics enables you to find answers to these questions by analyzing your website traffic. That way, you can improve your site based on your visitors’ actions.
To get the most out of Google Analytics you’ll need an introduction to the most important metrics it provides. In this article, we’ll introduce eight critical metrics, explain why each is important, and show you how to set them up if necessary. Let’s get started!
1. Acquisition Overview
The Acquisition Overview section, found by going to Acquisition > Overview after you log into Google Analytics, enables you to keep an eye on traffic sources – organic search, direct hits, referrals, and social media – and compare them.
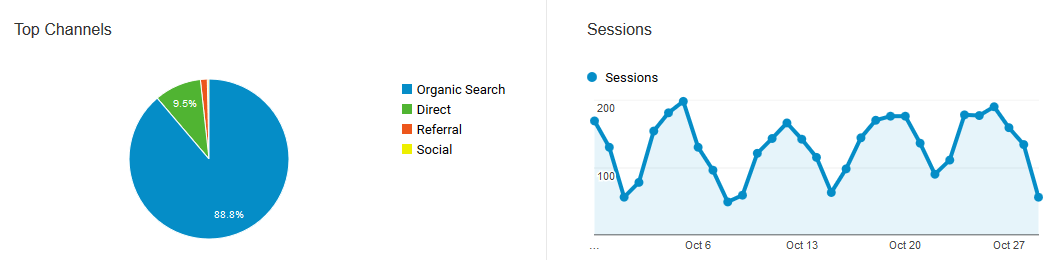
It’s one of the sections where you’re going to spend the most time. It also contains details about the number of sessions, percentage of new sessions, bounce rate, average session duration, and more. It provides you with a bird’s-eye view of your traffic sources and how users are engaging with your site.
Finally, once you set up a few goals (something we’ll get into a bit later), you can also keep track of your conversions and goals in the Acquisition Overview.
2. Social Overview
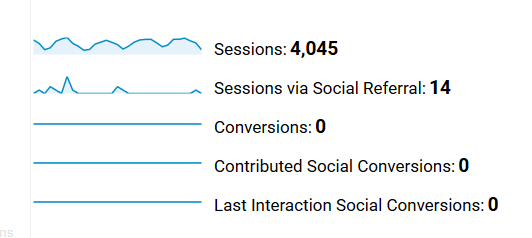
You can find the Social Overview section under Acquisition > Social. This tab enables you to measure what Google Analytics refers to as the ‘social relationship’, which is the impact of social media on your site. To do this, Google Analytics provides you with information about the networks where your content gets shared, your on-site user engagement, and the flow of users through your site.
 You can also create unique goals to track the value of social media to your conversions (we will get to setting up goals in a bit).
3. Bounce Rate
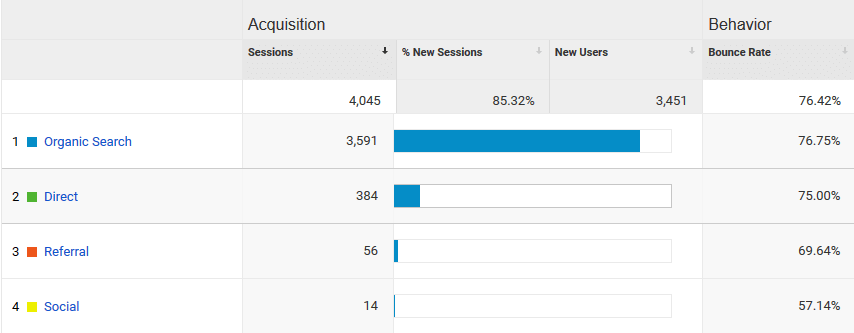
We’ve discussed bounce rates extensively in the past, and you should take a look at that article for a more in-depth discussion. Your site’s bounce rate represents the number of users that enter your site, then leave after viewing just a single page. You can see your site’s bounce rate by going to Audience > Overview and looking right below the main graph.
 The average bounce rate varies considerably from one type of site to the next. However, if yours is elevated (like our example above), you might have a problem on your hands – so remember to check out our piece on how to lower your site’s bounce rate.
4. Traffic Sources
Your traffic sources are located under Acquisition > All Traffic > Source/Medium. This section provides you with a comprehensive overview of all your sources using a simple table. Each row details to a single source of traffic and includes total sessions, new sessions, bounce rates, average session durations, and even goal conversions.
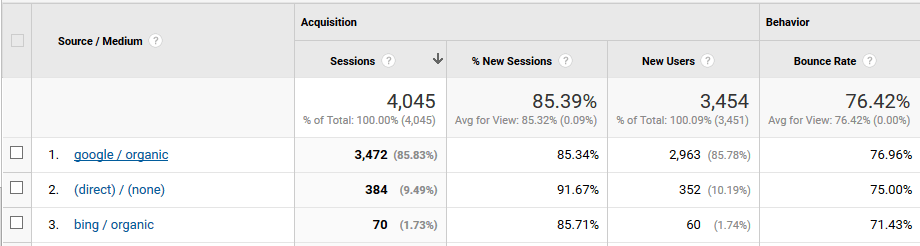
As your website grows, your list of traffic sources will expand – and keeping track of them all can become complicated. We recommend that you focus on tracking your performance across your top sources, and perhaps focus on a few underperformers that you feel have great potential to see if you can improve them.
5. Conversions
In marketing, a conversion occurs when a visitor takes a specific action that we’ve set up as our goal. Conversion goals can be subscriptions to a mailing list, purchases, pretty much anything you can track – if a visitor takes a specific pre-defined action, we count them as a conversion.
Google Analytics enables you to track several types of conversions. To gain access to this data, you’ll need to start tracking goals, which we will teach you how to do in a moment.
6. Behavior Flow
The Behaviour Flow section, found by going to Behavior > Behavior Flow, offers one of Google Analytic’s most exciting features. Here you can follow the journey that visitors go through when they arrive at your site, step by step.
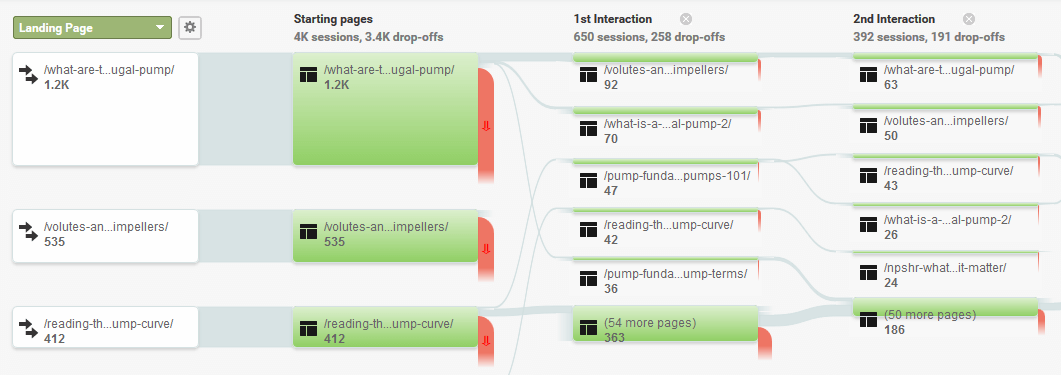
Using a simple flowchart, you can see which of your pages are attracting the most hits, how many users exit at each stage, and the routes they take. A savvy website owner will put this information into action and work to build stronger bridges to move users from one page to the next.
7. Exit Pages
You can view a list of your site’s exit pages by going to Behavior > Site Content > Exit Pages.
When you visit a site and view a few pages, your exit page is the last one you view. The rate at which each page serves as an exit page is not to be confused with its bounce rate. While the two values are related, they are not the same.
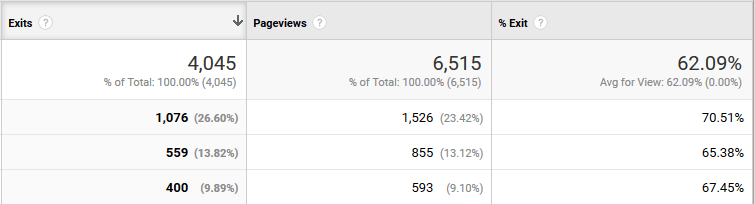
A high exit rate suggests that a particular page is losing visitors and may be a good candidate for A/B testing to keep users around for longer. Every user will exit at some point, but the better the overall experience, the longer they’ll stay.
8. Goals
We’ve talked a lot about goals throughout this article, so let’s get down to business.
As the owner of a website, you can pick any action you want and set it up as a goal. Even simple stuff, such as someone using a contact form, can be a goal. Whenever someone completes one of your goals, Google Analytics will count it as a conversion.
To set up goals, go to Conversions > Goals > Overview > Set up goals. You’ll find yourself under the Admin tab with two options: + NEW GOAL and Import from Gallery.
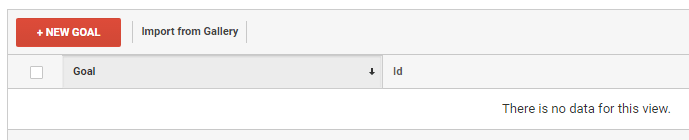
The first enables you to set up your own goal, while the second displays a gallery of community-made goals which you can use on your site. For example, here’s a popular goal for contact form submissions:

Google Analytic’s Solutions Gallery includes almost 3,000 goals, and chances are you will find some helpful ones in there, so give it a look. As far as setting up your own goes, Google Analytics’s help section walks you through the process from start to finish – and if you prefer video tutorials, they’ve also got you covered.
Conclusion
We’re not going to sugarcoat it – analytics can be a difficult field to wrap your head around if you’re just getting started. There are dozens of terms you need to understand, and countless metrics you can track. However, Google Analytics has made the process as simple as possible, and if you make an effort to learn the ins and outs of analytics, your site will thank you for it.
Here are eight key metrics you need to pay particular attention to when tracking your site traffic with Google Analytics:
- Acquisition overview.
- Social overview.
- Bounce rate.
- Traffic sources.
- Conversions.
- Interactions per visit.
- Exit pages.
- Goals.
Image credit: Negative Space.