- May 07, 2020
 0
0- by A2 Marketing Team
We’re big fans of reading, but many people these days prefer to consume their information in short snippets, with plenty of images to look at. While you can often adapt your articles to this format, certain messages work best in a different medium altogether.
That’s where infographics come in. If you’re presenting a complex topic, they can help make it more engaging and digestible. Infographics lend themselves naturally to being shared, even when they contain a lot of statistics or complicated concepts. They’re also pretty easy to create, even if you’re not a designer or web developer.
In this article, we’re going to talk about the benefits of using infographics, and then we’ll teach you how to use Canva to make one in five short steps. Let’s get creative!
What Are Infographics, And How Can They Help You?
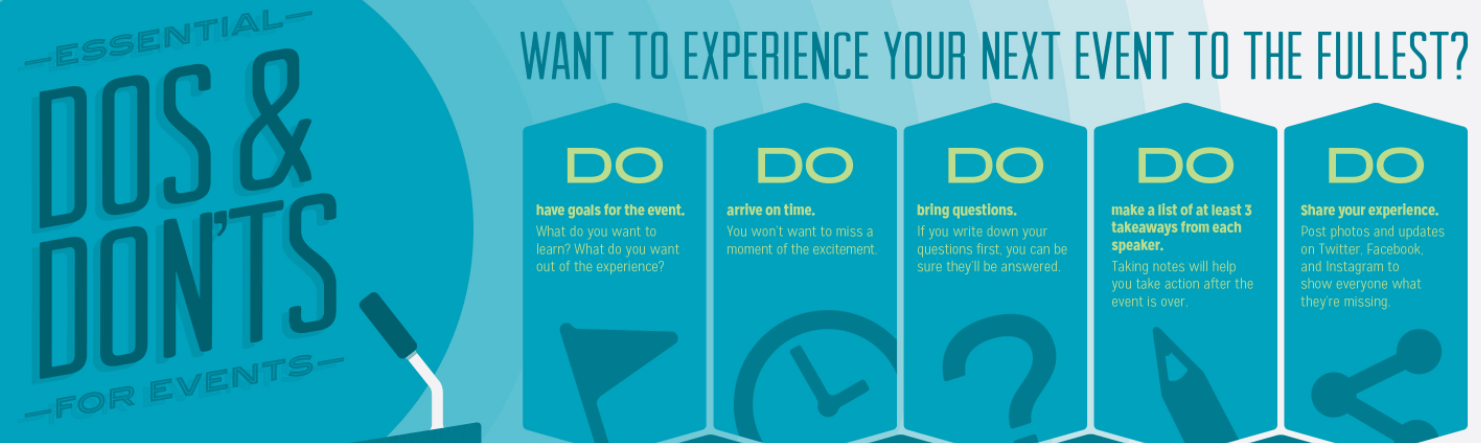
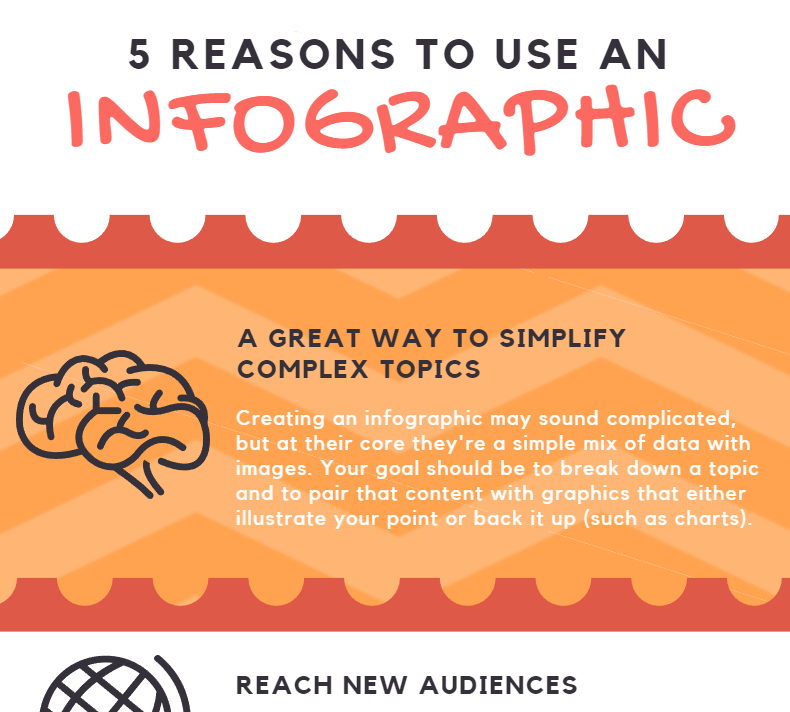
Creating infographics may sound complicated, but at their core, they’re a simple mix of text, numbers, and pictures. Your goal is to break a topic down into bite-sized chunks, and pair the content with graphics, such as charts, to illustrate or back up your point.
To be fair, it might be easier to write a straightforward article, but infographics have a lot of upsides. For example:
- You can simplify complex topics. Using small bites of content and data, such as survey findings, paired with graphics tends to make things easier to understand.
- You can create highly shareable content. Infographics have a well-earned reputation for being shared widely. If your creations become popular, they can boost your site traffic and attract new readers.
- You can reach a busy audience. Some people aren’t interested in reading entire articles, but they will stop and check out an interesting-looking infographic.
At this point, you’re probably asking yourself how you can put this information to use if you’re not a designer. Don’t worry – as we mentioned earlier, creating an infographic isn’t that complicated if you have the right tool.
How to Create an Eye-Catching Infographic Using Canva (In 5 Steps)
For this section, we’re going to use Canva to guide you through the process of creating an infographic. It’s a powerful tool that makes it easy to build a wide range of professional-looking graphics, and it also offers a solid free plan.
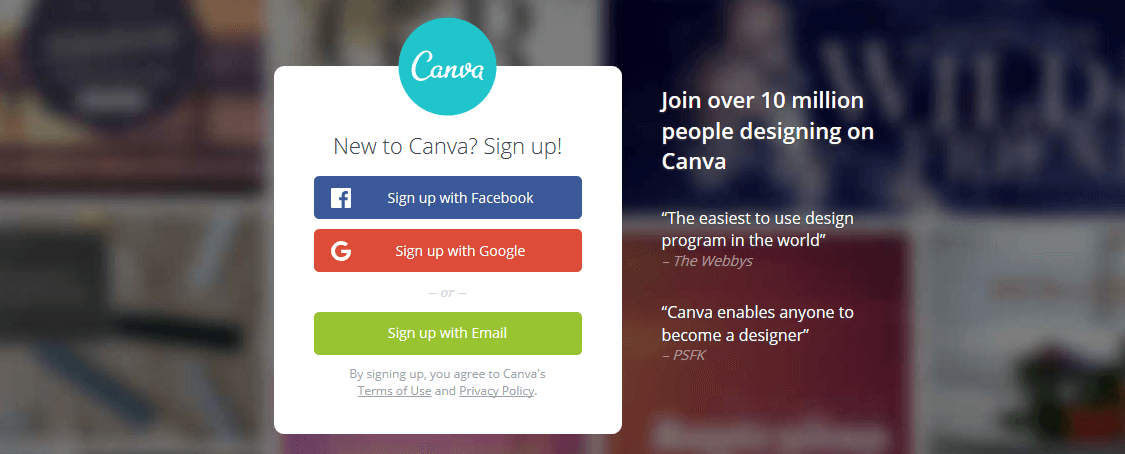
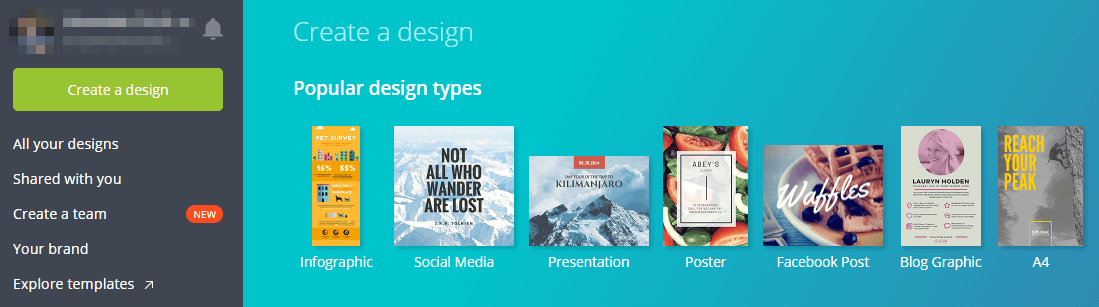
To get started, just sign up for a free account on Canva and then look for the option to create an infographic among the design types on your dashboard. Then, move on to step one.
1. Define Your Message and Draft Your Content
Before we go any further, you need to sit down and think about the content you want your infographic to include. Which topic to tackle is up to you, but we’ve listed a few steps to help you get organized:
- Outline your content and divide it into key sections.
- Write a brief introduction and conclusion.
- Summarize your points in bite-sized quotes that you can add to and move around quickly.
- Compile any statistics you’ll display to back up your data, and decide on the graphics you want to include.
Keep in mind that your introduction and conclusion are the only sections of your infographic where you always need to use full sentences. Depending on your content and layout, you might find it more appropriate to use sentence fragments to tell the story in the main section.
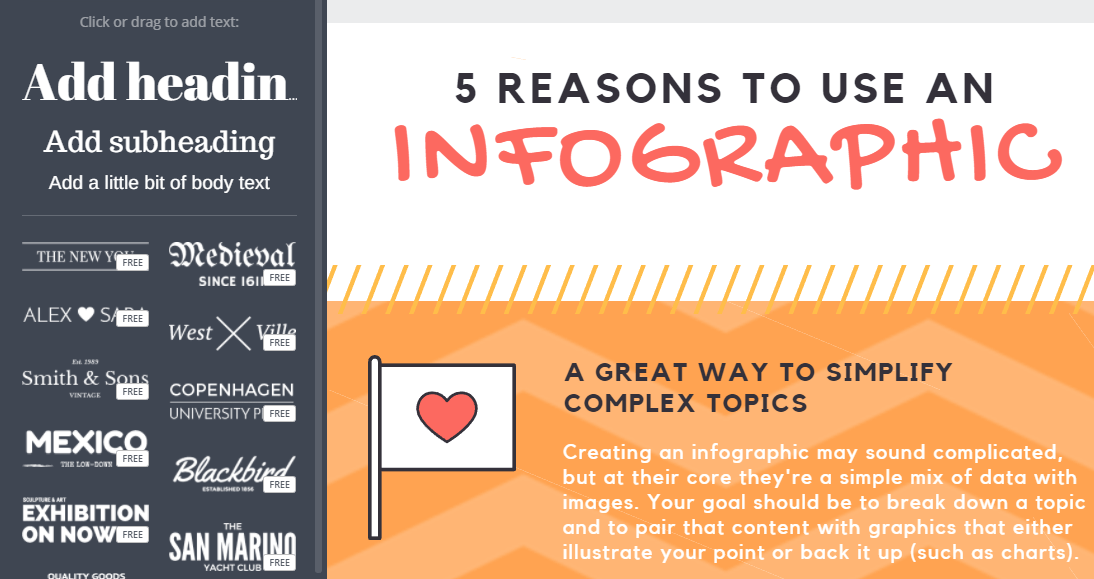
2. Choose a Layout for Your Infographic
Now that your content is ready, it’s time to pick a layout. If you haven’t already clicked on the Infographic design type, do so now…
…and you’ll be able to select the layout you want from Canva’s library:
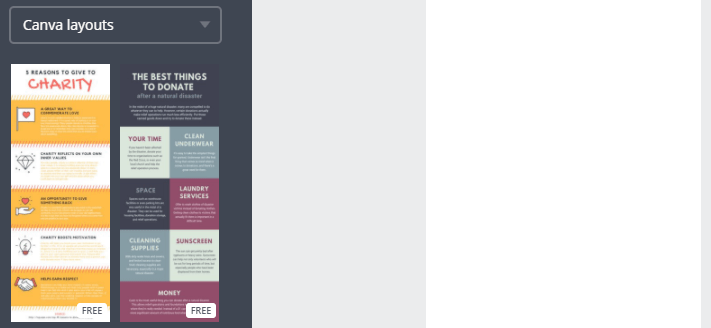
You’ll find a good range of infographic designs with either one or two-column layouts, so you’re bound to find one that works well with your content. It doesn’t have to be a perfect fit, however – you can change the size, and we’ll teach you how to customize elements too.
3. Change Your Infographic’s Background
Most layouts in Canva’s library are ‘ready-to-go’, which means they’re populated with filler content, and have backgrounds in place. Fortunately, it’s very easy to replace all these elements with your own. First, go to the Background tab on your Canva dashboard:
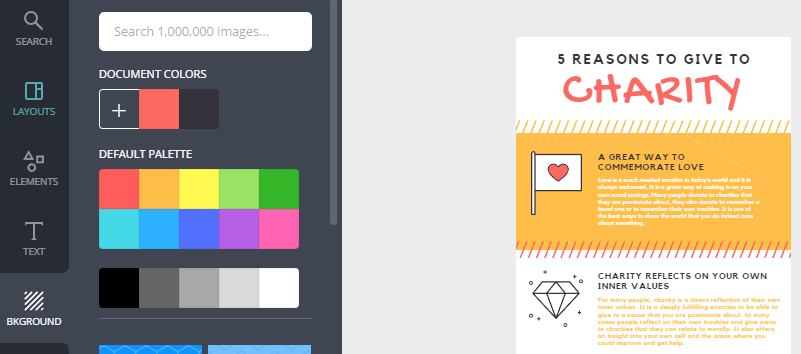
Now pick a color or texture to replace your layout’s default elements. Note that your choice will only replace those parts of your layout that aren’t blank by default. For example, take a look at ours:

All we did was replace our solid orange background with a pattern. Once you’ve made your choice, go ahead and replace your layout’s default background.
4. Add a Title and Text
Replacing the text on your infographic is also simple. All you need to do is go to the Text tab on your dashboard and then click on the snippet you want to edit:
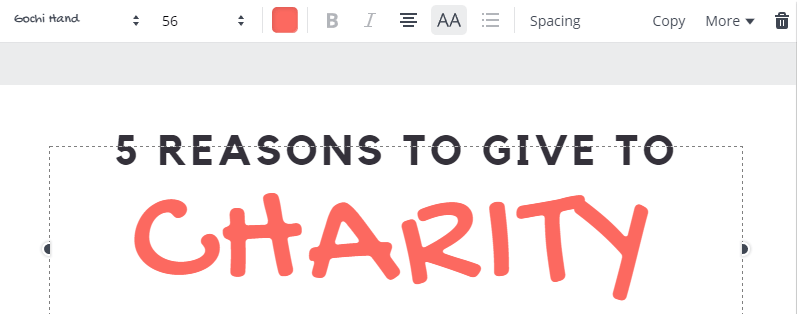
This will enable you to delete the placeholder text and type anything you want, as well as to format it or change the font. Now you need to do this for every section of your layout, using the content you prepared in step one. Once you’re done, your infographic should be almost ready.
All that’s left now is to customize it even further by replacing some of the custom graphics and other elements.
5. Customize Your Infographic Using Elements
Every Canva layout is built using its own set of custom elements that gives it a characteristic appearance. For example, the separator in this screenshot is a custom component that can be replaced:
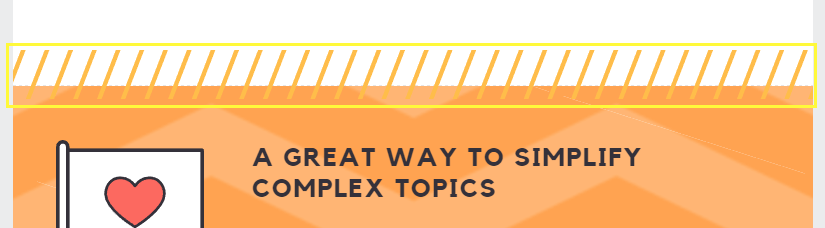
The same goes for the picture next to the text. To change each of these graphics, you’ll need to go to the Elements tab and choose the type of image you want to use:
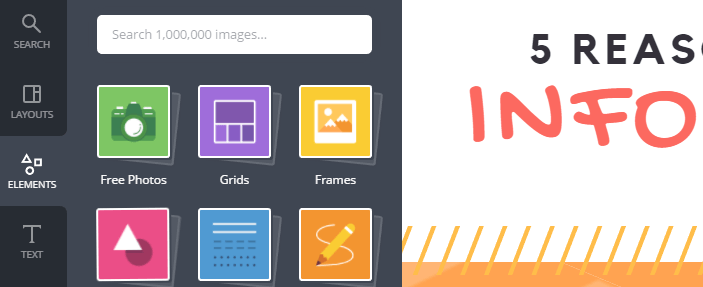
To change your separators, choose the Lines category and find a suitable option. Now, click on your existing separator and use the trash icon at the top of your screen to delete it:

Then, click on your chosen replacement and drag it to the right location, and resize it if necessary. It’s as simple as that. Replacing images works the same way, and Canva has an extensive library of stock graphics you can use free of charge. Here’s a look at our example after we’ve replaced a few more elements:
Now you just need to download your infographic, or share it directly from the platform. We recommend the former since it provides you with more flexibility. To do so, just click on the Download button on your dashboard, and you’re ready to go.
Conclusion
One of the most user-friendly ways to present a complex topic, especially if it’s data-driven, is to create an infographic. Few people want to wade through long articles or tables, but if you break the information down and show it in graphical form, you’re much more likely to catch your users’ attention, and hold it. Plus, infographics are often shared extensively online, so they can bring plenty of new eyeballs to your content.
Let’s recap the five steps to creating a stylish infographic using Canva:
- Define your message and draft your content.
- Choose a layout.
- Change your infographic’s background.
- Add a title and text to your layout.
- Customize your infographic using elements.
Image credit: Pixabay.